Figure 4.
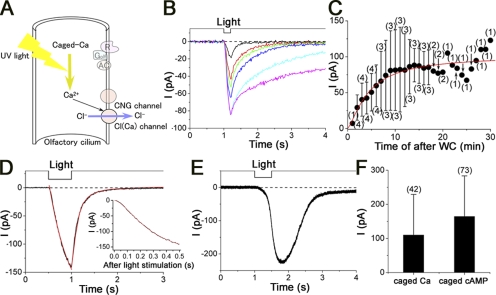
Responses induced by caged Ca and caged cAMP. (A) Schema of caged Ca-induced current response. The response is caused by bypassing the receptor to CNG level. (B) Change in the current amplitude and prolongation of the falling phase after the establishment of WC recording configuration. The currents were obtained after WC in 2 (black), 3 (red), 4 (green), 5 (blue), 10 (light blue), and 15 (pink) min, respectively. Downward deflection of the upper trace indicates the timing and duration of the light stimulation. Vh = −50 mV. Light intensity was 0.48. (C) Change of the current amplitudes after WC. Plots indicate the mean, and the error bars show the SD. Numbers in parentheses indicate the number of examined cells. Red smooth line was drawn by the Hill fittings with Hill coefficient (nH) = 1.6, K1/2 = 4.4 min, and Imax = 101.6 pA. (D) Time course of the caged Ca-induced current response. Curve fitting was made with the single-exponential function (red, rising phase of the caged Ca-induced current was fitted by the Hill function [red] with nH of 1.6). Light stimulation was 0.48. (E) Responses induced by caged cAMP. Light stimulation was 0.48. (F) Comparison of response amplitudes induced by caged Ca and caged cAMP. There was a statistical significance with t test (P < 0.05). Numbers in parentheses indicate the numbers of cells examined. Vh = −50 mV.

