Figure 7.
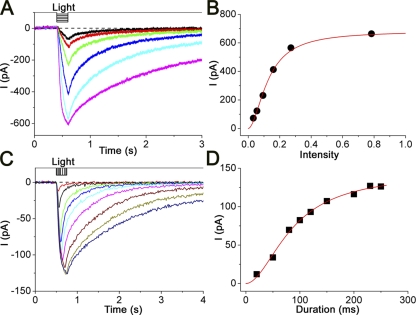
Intensity and duration dependence of the light-induced current response to caged Ca. (A) Membrane currents were recorded from various intensities (changed from 0.03 to 0.78). Duration, 200 ms. (B) Intensity–response relation of the light-induced current. Peak amplitudes of the current responses obtained from A were plotted against the intensity of the light stimulation. The smooth line shows the least-square fitting of data with the Hill equation. nH was 1.8. (C) Current responses were obtained with various durations (changed from 20 to 250 ms). Intensity, 0.48. (D) Time–response relation. Peak amplitudes of the current responses obtained from C were plotted against the intensity of the light stimulation. The smooth line was drawn by the least-square fitting of data by the Hill equation, with nH of 1.8. Vh = −50 mV.

