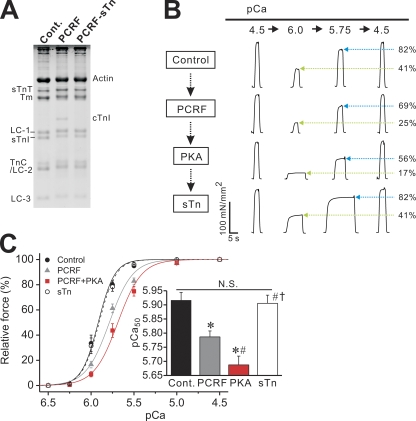
Figure 5.
Effect of PKA on Ca2+ sensitivity in PCRF-reconstituted RP. (A; Left) 15% gel showing reconstitution of RP with PCRF. Cont., control fibers; PCRF, PCRF-reconstituted fibers; PCRF-sTn, PCRF-reconstituted fibers treated with sTn; LC-3, myosin light chain 3. For other abbreviations, see legend to Fig. 2 A. (B) Typical chart recording showing force-pCa protocols. A fiber was treated with PCRF, PKA, and sTn, in this order. Green arrows (blue arrows) indicate percentage of force at pCa 6.0 (pCa 5.75) compared with the maximum obtained at the end of each force-pCa protocol. (C) Force-pCa curves showing the effects of PCRF reconstitution, PKA treatment, and sTn reconstitution in RP. Black solid line, control with no treatment; gray solid line, PCRF reconstitution; red solid line, PKA treatment; black dashed line, sTn reconstitution. (Inset) Summary of pCa50 values. *, P < 0.05 compared with control; #, P < 0.05 compared with PCRF; †, P < 0.05 compared with PKA. n = 10.

