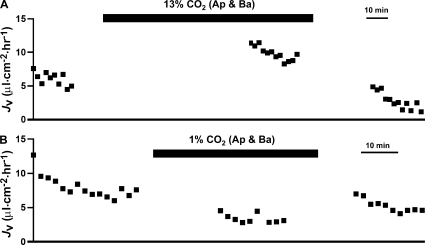
Figure 13.
CO2-induced changes in fluid absorption. 5% CO2 equilibrated Ringer was added to both solution baths, and JV was recorded with JV, TEP, and RT at steady state. The control Ringer was then replaced with either (A) 13% CO2 or (B) 1% CO2-equilibrated Ringer in both solution baths. JV, TEP, and RT values were recorded at steady state (15–30 min). Solid bars above the graphs represent solution changes from control Ringer as described in the legend to Fig. 2.

