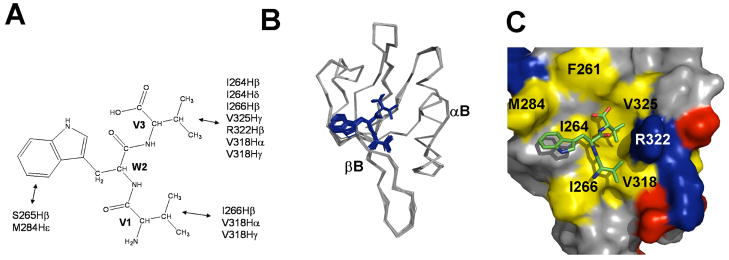
Figure 5.
Structures of the Dvl1 PDZ/VWV complex. (a) Summary of intermolecular NOEs between the tripeptide VWV and the Dvl1 PDZ domain. (b) The ensemble of the 20 lowest energy conformations of the Dvl1 PDZ/VWV complex. (c) The lowest energy conformation of the Dvl1 PDZ/VWV complex. Surface representation shows the binding interface between the Dvl1 PDZ domain and the VWV tripeptide. The hydrophobic amino acid residues in the Dvl1 PDZ domain surface model are drawn in yellow, the positively charged residues in blue, the negatively charged residues in red, and the uncharged polar residues in gray. Tripeptide is shown in the stick model (blue: VWV). The program Pymol was used to prepare the figures.

