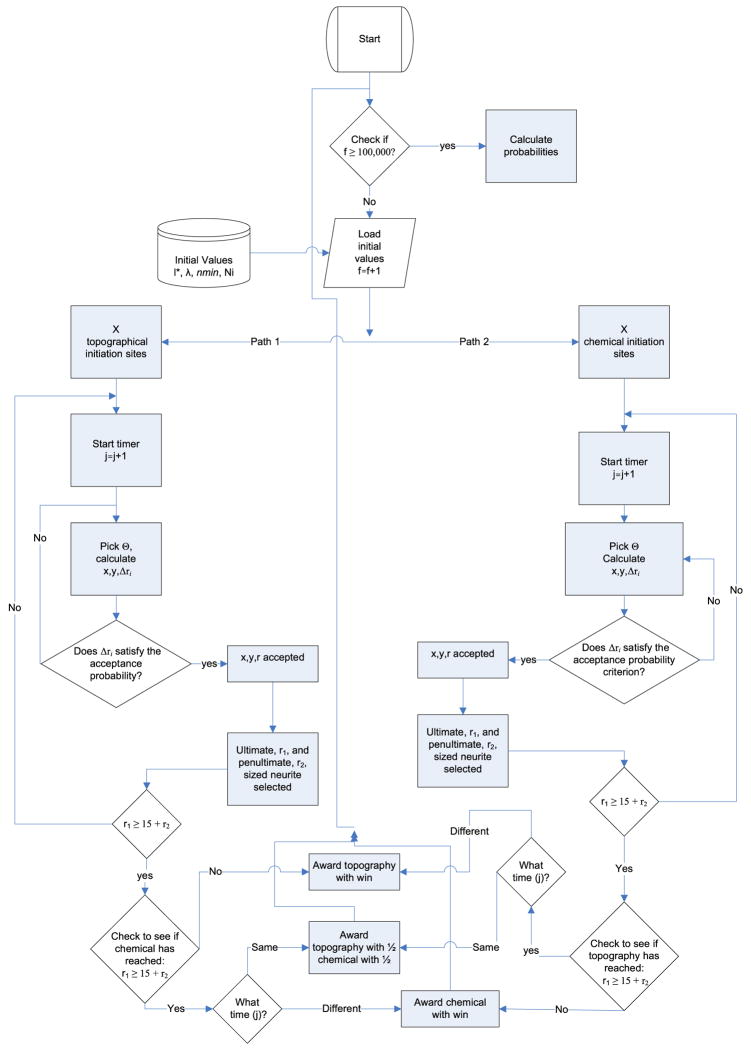
FIGURE 2.
State diagram. The above state diagram shows the logic tree for the algorithm used in our computational model. Briefly, the computation starts a timer, inputs initial conditions (l*, λ, nmin), and goes through two parallel paths. Path 1 leads to the topographical domain whereas path 2 leads to the chemical one. In each path, a random angle is chosen for each migrating neurite and new x, y coordinates are either accepted or rejected through an acceptance probability.

