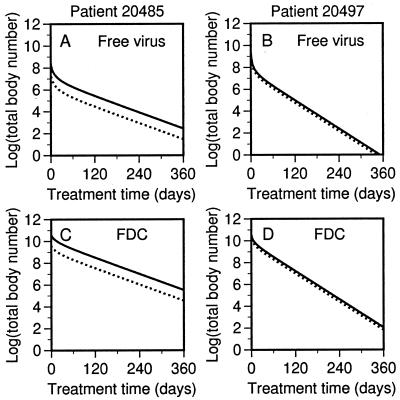
Figure 3.
Persistence of potentially infectious virus during therapy. The theoretical decay curves of Fig. 2 are replotted to show the total body numbers of potentially infectious (solid lines) and therapy-modified (dotted lines) viral particles that are (A and B) free in extracellular fluid and (C and D) associated with FDCs in LT.

