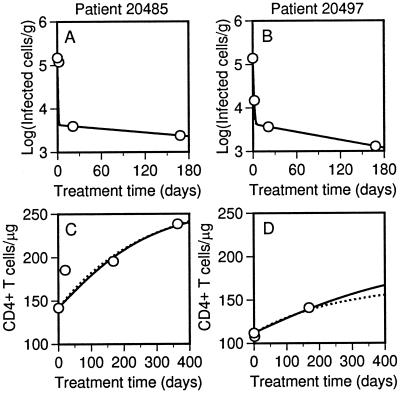
Figure 4.
Decay of infected cells and recovery of target cells in triple therapy patients 20485 and 20497. (A and B) Infected mononuclear cells per g of LT (points) (5) and the best-fit theoretical decay curve, found by calculating T* + C* as a function of treatment time t. (C and D) CD4+ T cells per μg of LT (points) (12) and the best-fit theoretical recovery curve, found by calculating T + T* + C* as a function of treatment time t. Solid lines correspond to calculations with λ = 0 (all target cell expansion because of proliferation), which are based on Eqs. 1–3 and parameter values in Tables 1 and 2. Dotted lines correspond to calculations with p = 0 (all target cell expansion caused by de novo generation), which are based on Eqs. 1–3 and parameter values in Tables 1 and 2 with the following exceptions. For patient 20485, p = 0, λ = 7.2 × 10⁸ d−1, and δ = 3.2 d−1. For patient 20497, p = 0, λ = 4.5 × 10⁸ d−1, and δ = 1.5 d−1.

