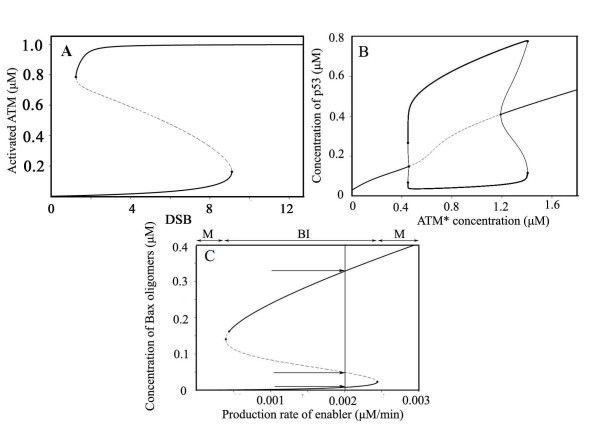
Figure 2.
Bifurcation diagram of three functional modules. A) Bifurcation diagram of activated ATM (ATM*) (Limit points: 1.22 and 9.10). B) Bifurcation diagram for p53 (Hopf bifurcation points are 0.47 and 1.20). C) Bifurcation diagram of oligomerized Bax versus production rate of Enabler (saddle node points are 0.0004 and 0.0024). Arrows indicate steady state values (0.008, 0.050, 0.328 μM from bottom to top, M: monostable. BI: bistable).

