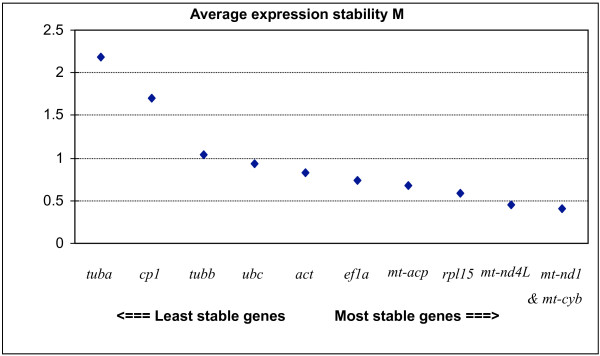
Figure 4.
Gene expression stability M of candidate reference genes calculated by geNorm. The geNorm program proceeds to the stepwise exclusion of the genes whose relative expression levels are more variable among samples. Data points represent the average expression stability values of remaining reference genes.

