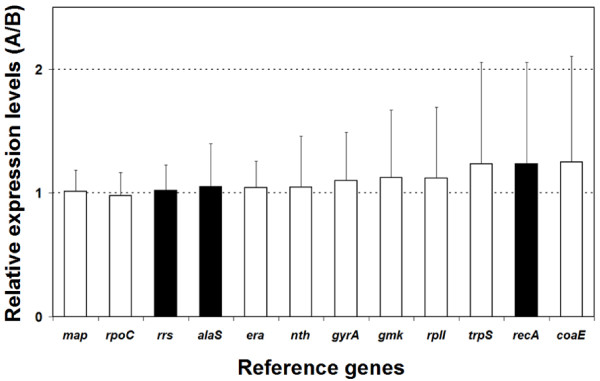
Figure 2.
Relative expression levels of alaS, recA and rrs and the nine candidate reference genes in all possible pairwise combinations (A/B) of five experimental conditions analyzed. Expression levels of the reference genes in each experimental condition (A) was compared to their respective expression levels in all other conditions evaluated (B). Boxes represent the average ratios (A/B) in all possible pairwise combinations of experimental conditions analyzed and bars represent the standard deviations of the average ratios A/B. White boxes correspond to reference genes selected after applying the strategy outlined in Figure 1. Black boxes correspond to reference genes previously used in A. ferrooxidans research [28,30,45].

