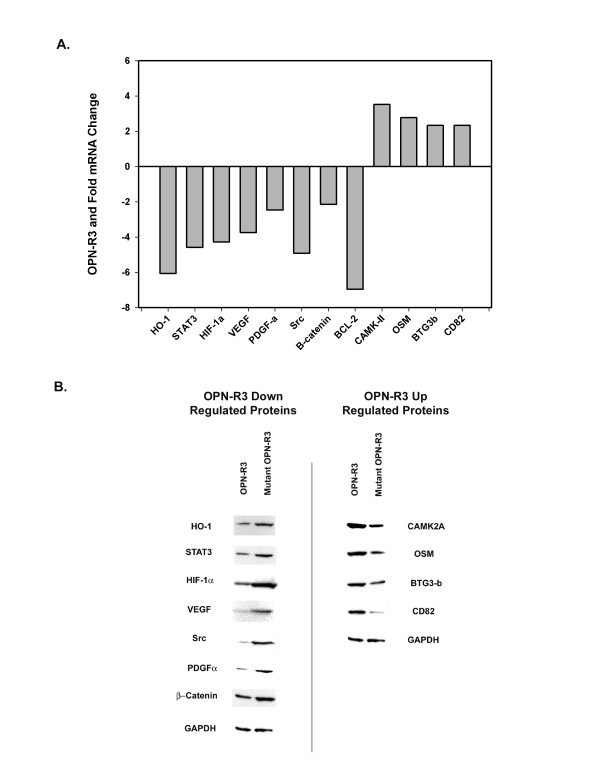
Figure 3.
Verification of Microarray Results. A. Histogram of mRNA changes in MDA-MB231 primary tumor from animals treated with OPN-R3 and/or Mutant OPN-R3. Real-time PCR was performed and the 2-delta-delta Ct value was calculated following GAPDH normalization. Fold induction was determined relative to cells treated with Mutant OPN-R3. A total of six animals were analyzed (OPN-R3, n = 3; Mutant OPN-R3, n = 3). Data are representative of three experiments. B. Western blots of differentially expressed proteins in MDA-MB231 primary tumor from animals treated with OPN-R3 and/or Mutant OPN-R3. Blots are representative of three experiments.

