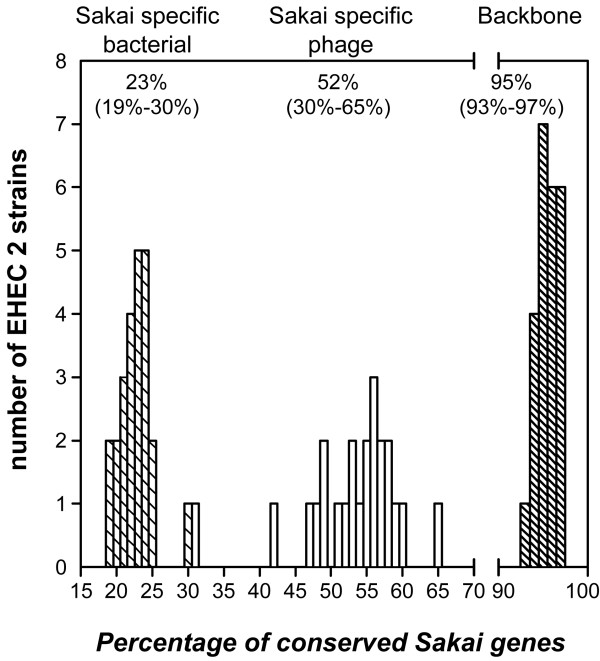
Figure 2.
Distribution of Sakai genes among EHEC 2 clinical strains. The three histograms represent distribution trends of three Sakai gene groups in EHEC 2 strains: Sakai bacterial genes (left histogram – hatched bars), Sakai phage genes (middle histogram, open bars), and backbone genes (right histogram – hatched bars). The levels of Sakai gene content conservation were calculated for each EHEC 2 strain by dividing the number of Sakai genes, from a particular gene group, found in a strain by the total number of Sakai genes from the respective gene group, represented on the oligoarray; these values were expressed as percentages. Each bar represents the number of EHEC 2 strains that were found to have the same percentage of Sakai gene content conservation. Each strain is represented on each histogram and the bars in each histogram add up to 24, the total number of strains investigated. One exception is the bar representing Sakai phage gene content conservation in strain DEC9f, which is hidden by the hatched bar representing the Sakai bacterial gene content conservation in strain CB7505. As can be seen in Table 3, strain DEC9f has 30% of Sakai phage genes and strain CB7505 has 30% of Sakai bacterial genes, causing the bars to overlap. Numbers above each plot represent the average for each group of genes and the range of the distribution is given in parentheses.

