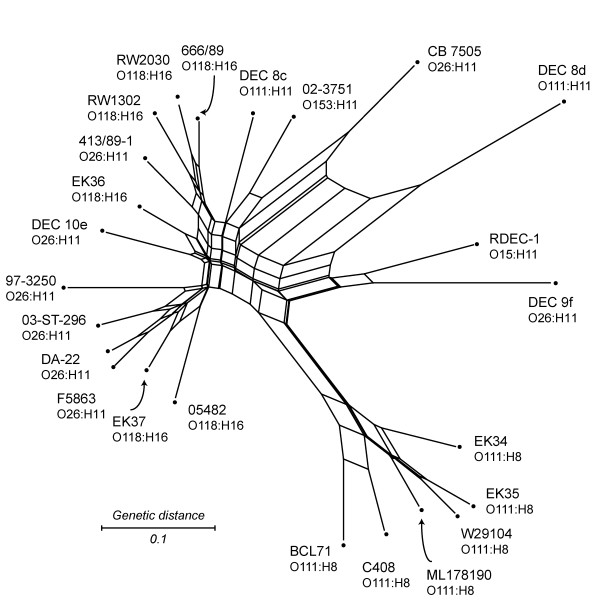
Figure 3.
Split decomposition analysis of Sakai genes in 24 EHEC 2 strains. The network was generated based on the presence/absence of 4800 Sakai genes among 24 EHEC 2 strains. 144 genes were excluded because their probe intensities were below those of randomized negative controls in the various Sakai/EHEC 2 hybridizations. Node labels refer to strain names (listed in Table 1). Parallel edges represent phylogenetic incompatibilities in the data set, which are indicative of parallel gene gain/loss by multiple transduction events. The network was generated in Splitstree 4.3, using neighbor net with the uncorrected p distance. Scale bar represents number of gene differences (present or divergent/absent) per gene site.

