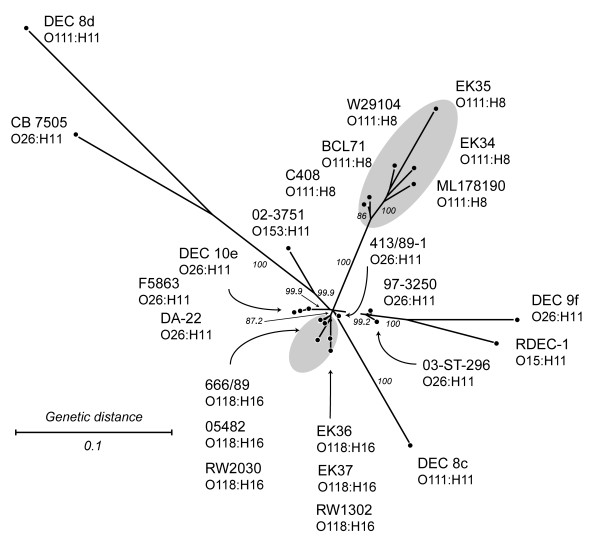
Figure 4.
Split decomposition analysis of compatible parsimony informative genes and singleton genes in 24 EHEC 2 strains. Gray ovals encompass serotype-specific clusters of O118:H16 and O111:H8 strains. Node labels refer to strain names (listed in Table 1). The network was generated in Splitstree 4.3, using neighbor net with the uncorrected p distance. Scale bar represents number of gene differences (present or divergent/absent) per gene site. Percent bootstrap confidence values based on 1000 replicates are shown for selected edges.

