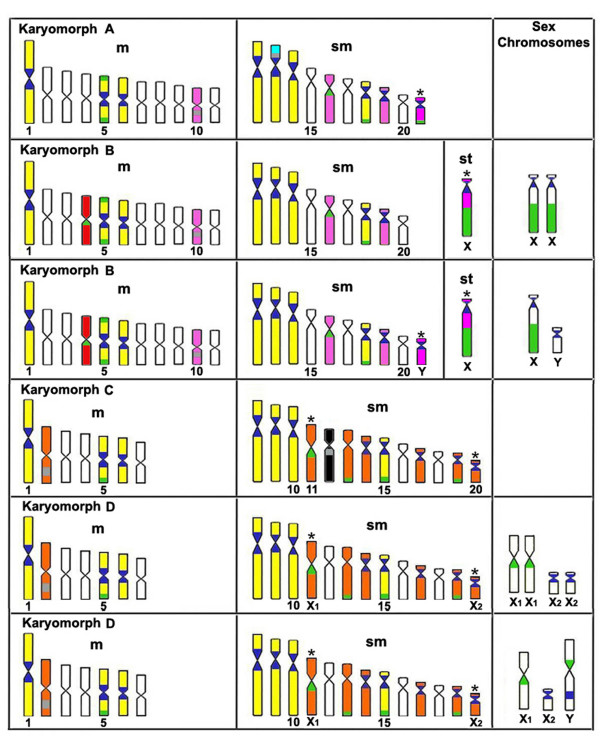
Figure 5.
Representative idiogram of Hoplias malabaricus karyomorphs A-D, on the basis of repetitive DNA sequences analyzed. The sites location of the satellite 5SHindIII-DNA, 18S rDNA and 5S rDNA on the chromosomes is indicated in deep blue, green and gray, respectively. Yellow indicates the corresponding chromosomes of karyomorphs A-B-C-D; pink indicates the corresponding chromosomes of karyomorphs A-B and in orange are indicated the corresponding chromosomes of karyomorphs C-D. The chromosomes bearing markers that are exclusive of karyomorphs A, B and C are indicated in blue, red and black, respectively. The asterisks indicate probable relationships between the sex chromosomes of karyomorphs B and D with some autosome pairs of karyomorphs A and C, respectively.

