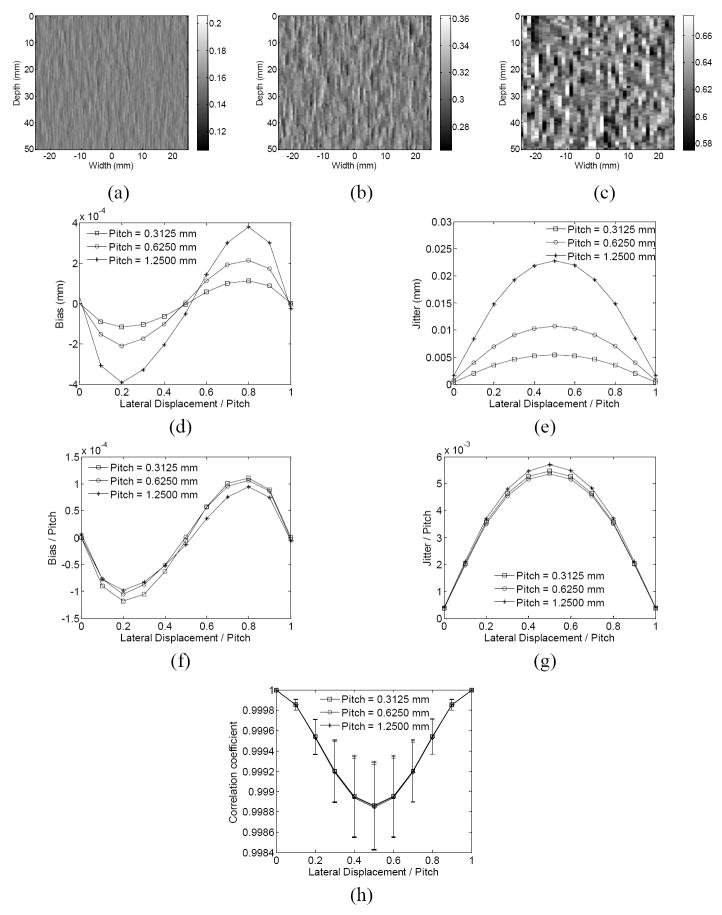
Figure 5.
The estimated lateral displacement images with a beam overlap of 68.75% and lateral displacement of 0.5 pitch and pitch of (a) 0.3125, (b) 0.625 and (c) 1.25 mm, and the (d) bias and (e) jitter of estimation in millimeter , the (f) bias and (g) jitter divided by the pitch and the (h) correlation coefficient (average ± SD) as a function of the lateral displacement normalized by the pitch in the simulation. In (e)-(h), the lateral displacement ranges from 0 to 1 pitch and is normalized by the pitch. The pitch is equal to 0.3125, 0.625 and 1.25 mm, respectively, while the corresponding beamwidth is equal to 1, 2 and 4 mm, respectively. The beam overlap remains the same (68.75%).

