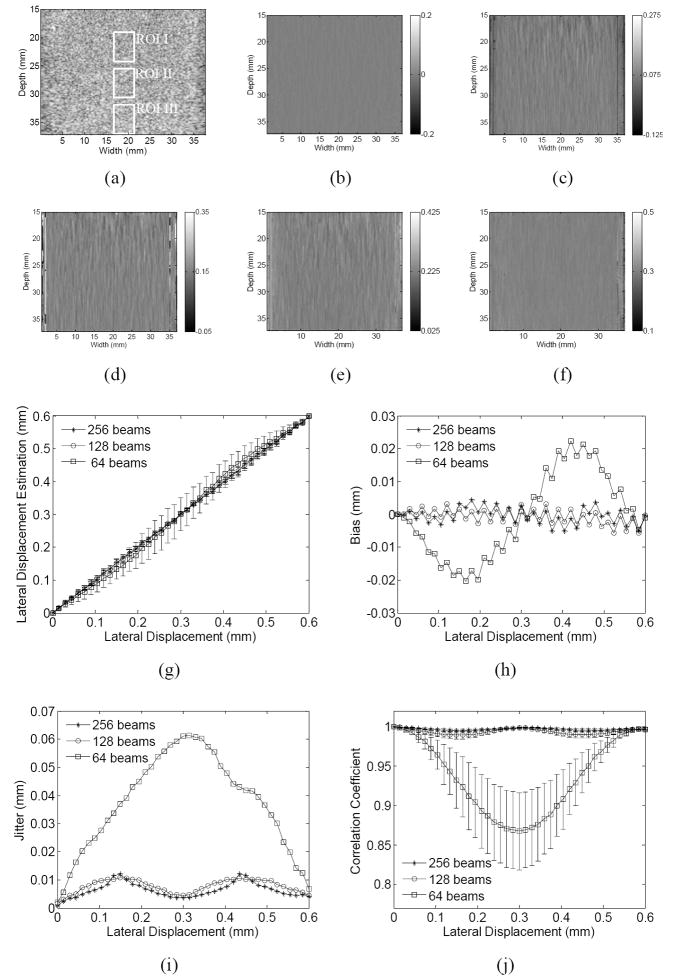
Figure 7.
The (a) B-mode image of the phantom, the estimated lateral displacement images when the lateral displacement between the reference and comparison frames is (b) 0, (c) 0.25, (d) 0.5, (e) 0.75 and (f) 1 pitch with the use of 128 beams, (g) the estimated lateral displacement (mean ± SD) as a function of the true displacement, (h) the estimated displacement (average ± SD), the (h) bias and (i) jitter of estimation and (j) correlation coefficient (average ± SD) with the use of 256, 128 and 64 beams, respectively. In (g)-(j), results are calculated from region III indicated in (a).

