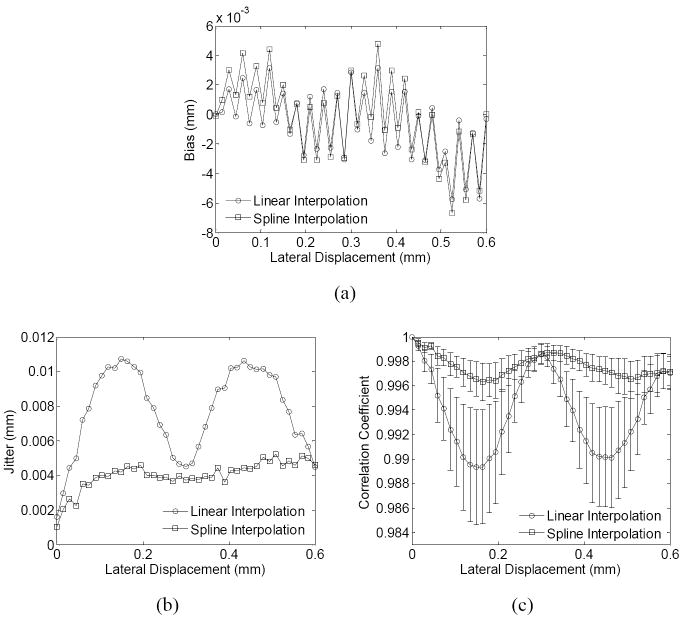
Figure 9.
The (a) bias and (b) jitter of estimation and (c) correlation coefficient (average ± SD) in the phantom experiment, with the use of different lateral interpolation methods on the RF signals. Results are calculated from calculated from region III indicated in Fig. 4 (c). (pitch = 0.3 mm).

