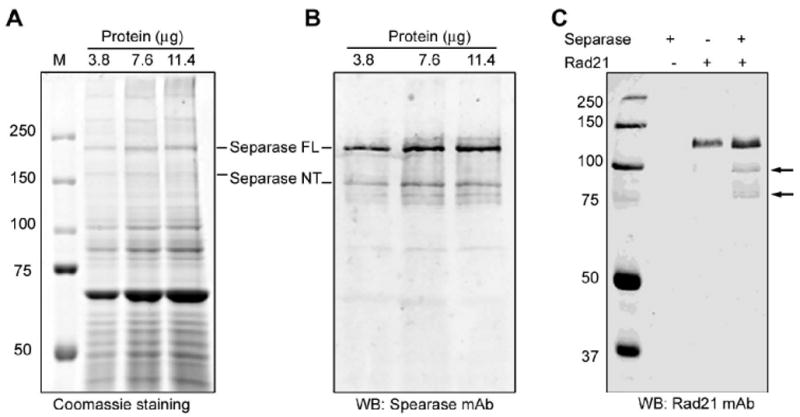
Figure 1.

Isolation and activation of Separase. The Separase was immunoprecipitated from 293T and activated with Xenopus egg extract. (A-B). Estimation of active Separase protein concentration. Five, 10 and 15μl (equivalent to 3.8, 7.6 and 11.4μg input protein) of the activated Separase preparation were resolved on a 7% SDS-PAGE. The protein bands were visualized with Coomassie staining (A) and the Separase bands were probed with anti-Separase mAb on immunoblot (B). Full length and the autocleaved Separase bands vs. total band intensities on Coomassie gel were quantified using Imagequant software. Activated Separase protein concentration was calculated as a fraction of Separase band optical density over the total band intensities from the Coomassie gel and estimated to be ∼33.5ng/μl. (C). Immunoblot of Rad21 cleavage assay using activated Separase. The assay was performed at 37°C for 1h. The protein was resolved on 8% SDS-PAGE. Full length Rad21 and cleavage fragments (arrows) were visualized with anti-Rad21 monoclonal antibody.
