
Figure 8. Morphology of gp26-MiCRU-foldon fibers.
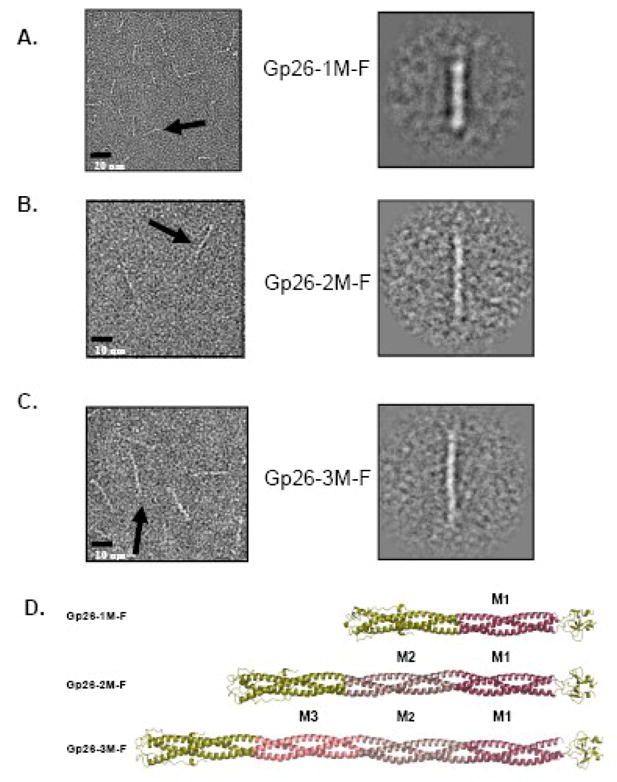
(A, B, C) Left panels show representative micrographs of purified gp26-1M-F, gp26-2M-F and gp26-3M-F stained with 1% uranyl formate. Right panels show relative projection averages for each of gp26-(n)M-F fibers. The approximate length estimated from the projection averages is 180, 265 and 355Å, for gp26-1M-F,17 gp26-2M-F and gp26-3M-F, respectively. (D) Ribbon models for gp26-1M-F, gp26-2M-F and gp26-3M-F with MiCRUs labeled as M1, M2, M3 and color-coded in red, magenta and pink, respectively.