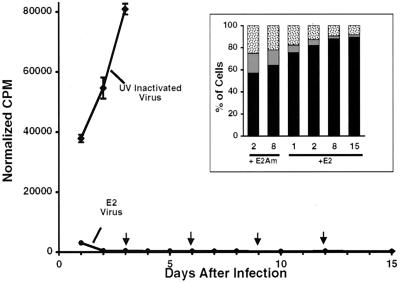
Figure 1.
Effect of E2 expression on cellular DNA synthesis and cell cycle progression. HeLa/sen2 cells were assayed for incorporation of [3H]thymidine at the indicated days after infection with the E2 virus or treatment with UV-inactivated virus. cpm incorporated per hr of labeling time are shown, with the error bars indicating 2 standard deviations of the mean. The cells were fed with medium containing 10% FBS on the days indicated by arrows. (Inset) Cellular DNA content as determined by flow cytometry on the indicated days after infection with the E2 virus or the E2 amber mutant. The solid portion of each bar corresponds to cells with a G0/G1 phase DNA content, the gray portion to cells in S phase, and the stippled portion to cells in G2/M phase.

