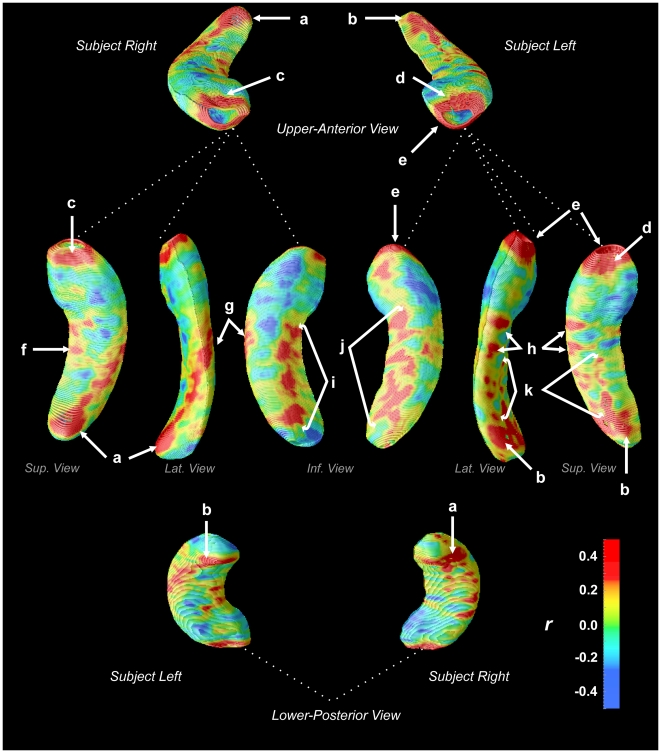
Figure 2. Effect size of hippocampal volume reduction in CCHS subjects relative to control subjects (Pearson's r, scale bottom-right).
Regions of positive effect size (yellow-red colors) indicate volume reduction in CCHS. Region labels are the same as Fig. 1: a, b – CA1/CA2, near fimbria; c right rostral = CA1-CA3, DG; d left rostral = CA1-CA3, DG; e left ventral = CA1, subiculum; f = right subiculum; g, h = CA1; i, j = subiculum; k = CA1/CA2.

