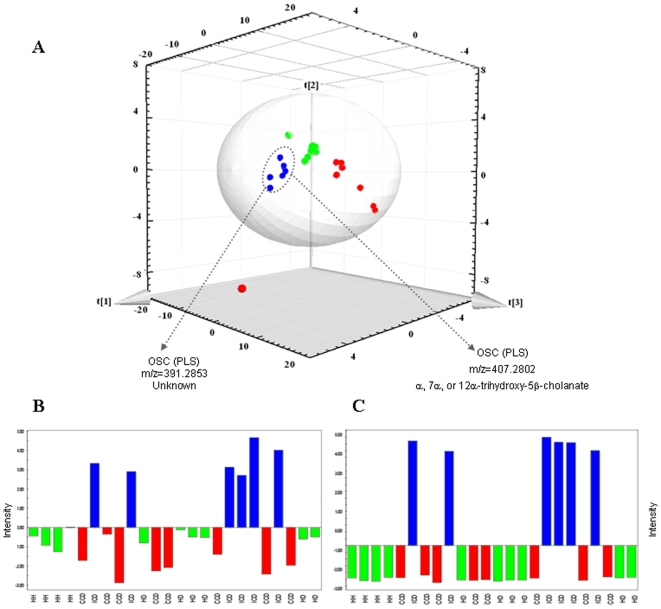
Figure 1. (A) Score and loading scatter plot of PLS analysis (Q2(cum) = 0.96, R2(Y) = 0.95).
(blue • = ICD, red • = CCD and green • = Healthy). The masses with the highest regression coefficients were considered as discriminant. Coordinates on the figure axes are ×108. (B) Example of a differentiating metabolite for ICD (assigned at m/z of 391.2853) that is up regulated in the ICD group but the structure is unknown. (C) Mass at m/z of 407.2802 corresponding to 3α, 7α, or 12α-trihydroxy-5β-cholanate within the bile acid biosynthesis pathway. The intensities in B and C were normalized.

