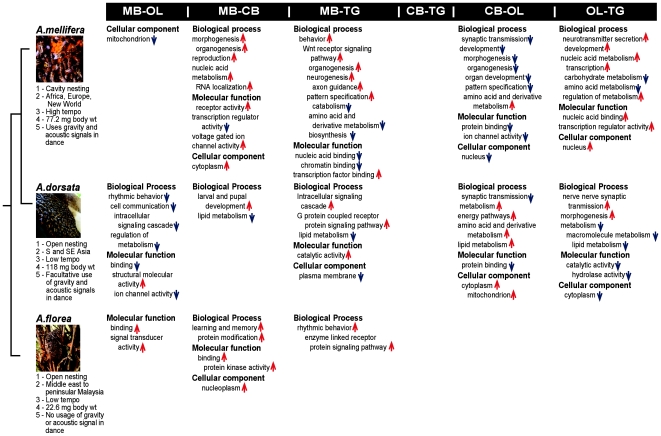
Figure 4. Results of GO enrichment analysis of genes that showed species by CNS region differences in gene expression, based on pair-wise comparisons of the CNS regions (p<0.01, Chi-Square test with Yates continuity correction).
First column shows the species with relevant differences in behavior and ecology with phylogenetic ranking after [68], [69]. Upward arrows indicate upregulation of enriched genes of a given GO class in the first brain region of the pair, while downward arrows indicate upregulation of enriched genes of a given GO class in the second brain region of the pair. Abbreviations as in Table 1.

