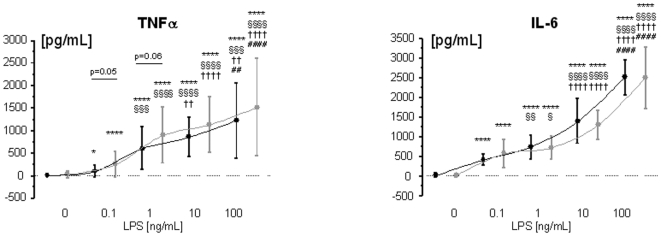
Figure 1. LPS-stimulated production of TNFα (panel A) and IL-6 from whole blood from healthy control subjects (n = 11, black line) and patients with CHF (n = 42, gray line).
* vs. unstimulated control (0 ng/mL LPS); § vs. 0.1 ng/mL LPS; † vs. 1 ng/mL LPS; # vs. 10 ng/mL LPS. One symbol denotes p<0.05, two symbols p<0.01, three symbols p<0.001, four symbols p<0.0001.

