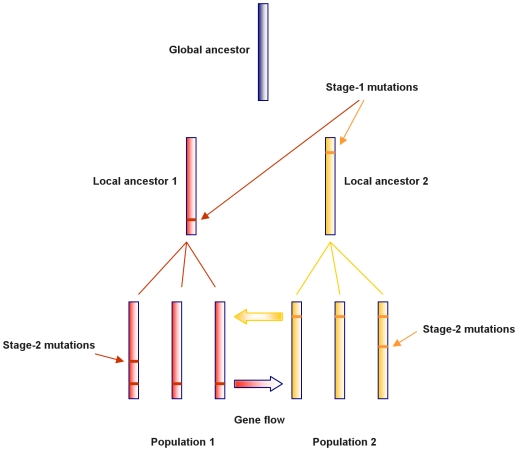
Figure 1. Graphical representation of the evolutionary model for a sample of two bacterial populations.
Strain sequences are represented as vertical bars with horizontal lines indicating the mutations that have occurred since the global ancestor. Stage-1 mutations are defined as those that occurred on local ancestors which provide candidate sites for gene flow between the populations. Mutations that occurred after the local ancestors are referred to as stage-2 mutations.

