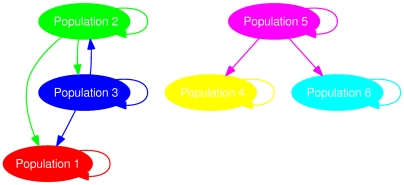
Figure 2. Tentative gene flow graph in six populations.
The graph topology can be succinctly termed as  , where the node set
  and the arrow set
  . The actual rates of admixture associated with the arrows were randomly generated from a uniform distribution. Note the two ways of gene flow between population 2 and 3.

