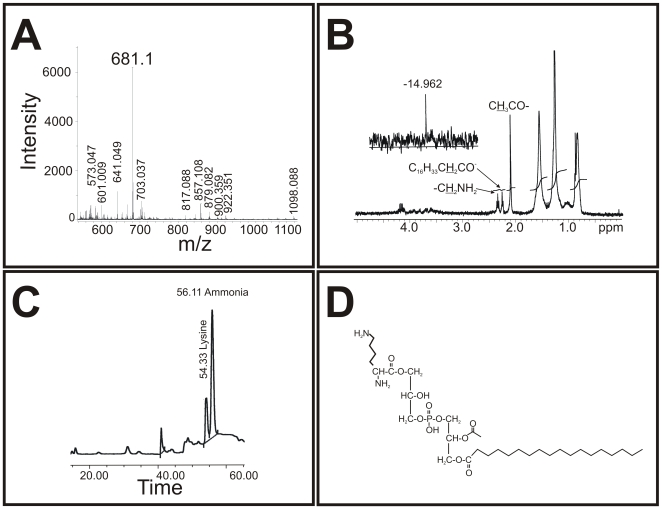
Figure 2. Structural analysis of L-PoL.
A: MALDI mass spectrometry analysis of L-PG in negative-ion mode. The m/z 681 [M-H]− represented the molecular ion peak. B: Structural analysis of L-PG. 1H-NMR spectrum of L-PG. The acetyl group can be found at δCH3 2.1 ppm, and δCH2 from the primary amine in lysine was detectable at 2.4 ppm. The inset shows the 31P-NMR spectrum, in which the phosphorus resonance shifted at −14.96 ppm. C: The amino acid profile of L-PG. Pure lipid was hydrolyzed with 6 N HCl for 24 h, and the soluble hydrolytic product was analyzed in an amino acid analyzer. Note that the elution of lysine at 54.33 min coincides with the standard (not shown). The small peak at position 41 min corresponds to a buffer change during the run, and the ammonia peak at 56.11 min is from the buffer used to run the analyzer. D: The proposed L-PG structure. The proposed structure of L-PG with a C18 fatty acid identified from fatty acid analysis (data not shown).

