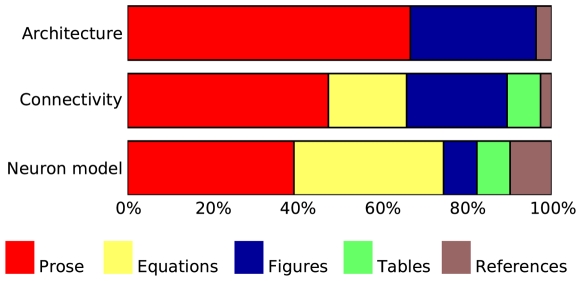
Figure 2. Use of different means of description in papers surveyed.
Bar graphs show the percentage of papers describing (from top to bottom) model architecture, model connectivity and neuronal dynamics using prose, equations, figures, tables, and references. Many papers combine several means for one purpose and are thus counted in several categories. For detailed data, see supporting material Tables S1, S2, S3.

