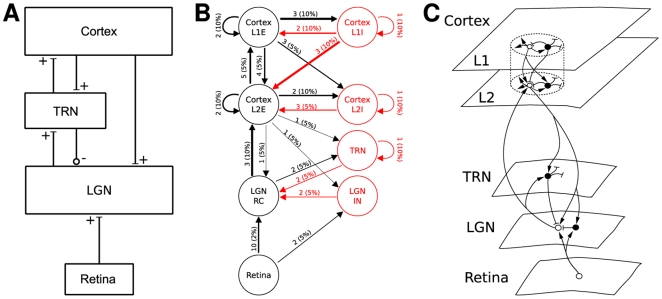
Figure 4. Diagram styles for network models.
Diagrams of a model of the thalamocortical pathway drawn using diagram styles from (A) Hayot and Tranchina [6], Fig. 2, (B) Haeusler and Maass [5], Fig. 1, and (C) Lumer et al. [10], Fig. 1. Numbers on arrows in B mark connection weight and probability of connection, while line width represents the product of the two. In C, open circles show excitatory, filled circles inhibitory neurons. The model depicted is loosely based on Einevoll and Plesser [63, Fig. 3], but the differentiation into two cortical layers, each with excitatory and inhibitory subpopulations, in B and C, as well as the connection weights and probabilities, have been added here for the purpose of illustration.

