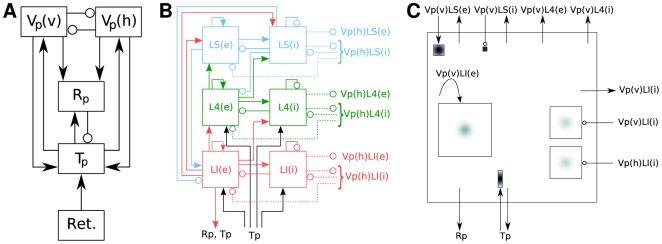
Figure 9. Hierarchy of diagrams of a complex network model (Lumer et al. [10]).
(A) Overview diagram of connectivity between high-level populations. Excitatory connections are marked by arrows, inhibitory connections by circles. Excitatory and inhibitory populations have been lumped in Tp, while Vp(v) and Vp(h) are composed of three layers of excitatory and inhibitory populations, as detailed in B. (B) Detailed diagram of connectivity within cortical population Vp(v), which is tuned to vertically oriented stimuli. Vp(v) is composed of three cortical layers, each with an excitatory (left) and inhibitory (right) subpopulation. Filled arrows mark excitatory, open circles inhibitory connections. Connections to and from corresponding horizontally tuned cortical populations in Vp(h) are shown as dashed lines; black lines show input from the thalamus. Connections to and from higher cortical areas are not shown. (C) Detailed rendition of connection masks and kernels projecting onto one cortical subpopulation Vp(v)LI(e) from panel B, i.e., the excitatory subpopulation of the infragranular layer of Vp(v). Squares show projection masks, gray shade the probability of a connection (black:  ). Connections are created by centering the mask about each location in the layer and drawing connections according to the probability distribution. Outgoing arrows indicate projections to other populations. Projection masks are scaled down in size to fit all projections into the layer, and grayscales have been adjusted for visibility. Connections are placed to correspond to the layout of panel B: Connections to and from thalamus are at the bottom, connections to and from Vp(v)LI(i) and Vp(h) to the right and connections to and from Vp(v)LS and Vp(v)L4 at the top.

