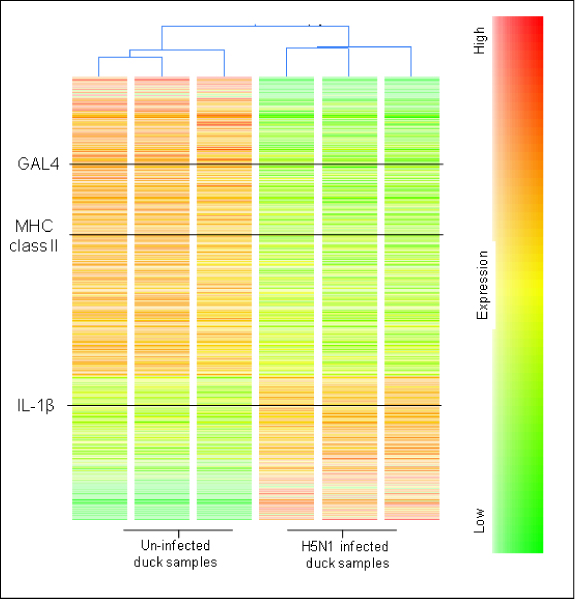
Figure 3.

Condition tree of H5N1 infected and uninfected ducks. Average signal log intensities are presented, highlighting the strong relationship between the H5N1 infected samples compared to the uninfected duck controls. Immune genes of particular interest are shown in black.
