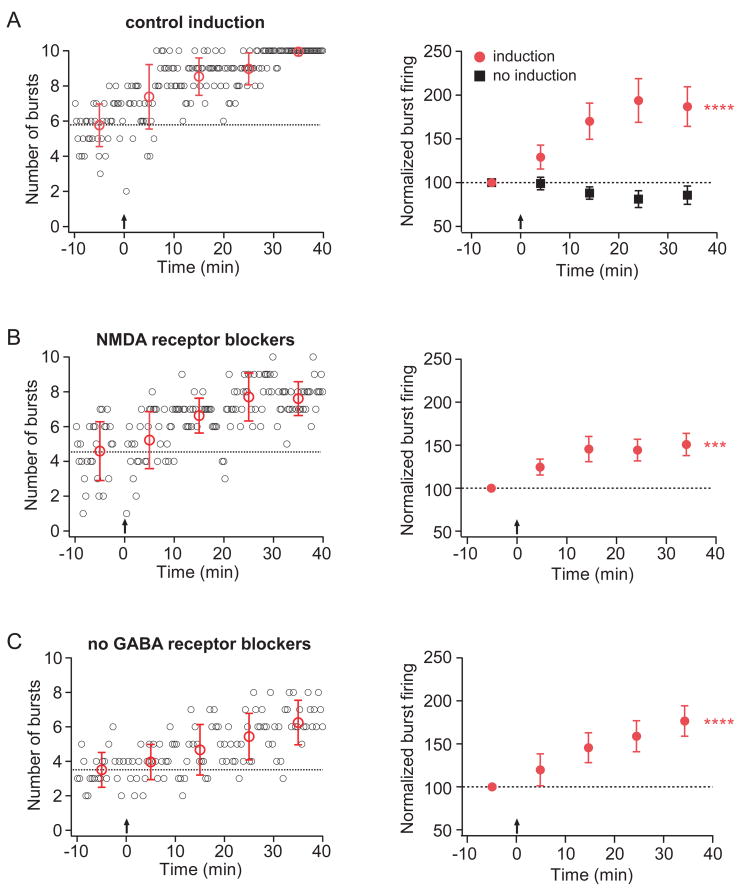
Figure 2. TBS results in an enhancement of burst firing that does not require NMDA or GABA receptor activation.
For all representative-experiment graphs (left column), small open circles (black) indicate the number of burst firing responses evoked by a train of 10 EPSC-like somatic current injections. The train was delivered every 20 seconds. Large open circles (red) represent the average number of burst firing responses per train for each 10-minute period. Error bars are ± standard deviation. For all group-data graphs (right column), filled symbols represent the average number of burst firing responses per train for each 10-minute period. Error bars are ± s.e.m. For all graphs, dotted lines indicate the average number of burst firing responses per train for the 10-minute baseline period. Arrows indicate when TBS (induction) was given. Asterisks indicate a significant effect of time, repeated measures ANOVA.
A. Representative (left) and group (right, red circles; n=10) data from experiments in which TBS was given in control conditions. Group data (right, black squares; n=9) are also shown for experiments in which no TBS was given. B. Representative (left) and group (right; n=8) data from experiments in which TBS was given in the presence of NMDA receptor blockers (50 μM D-AP5 and 20 μM MK-801) C. Representative (left) and group (right; n=8) data from experiments in which TBS was given in the absence of GABA receptor blockers.

