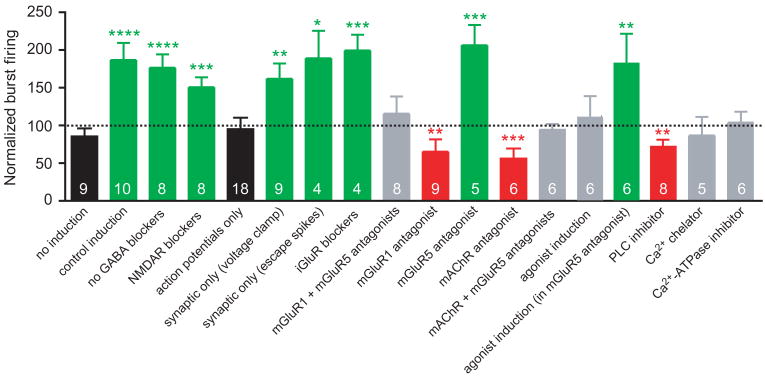
Figure 8. Summary of burst firing plasticity under different experimental conditions.
Normalized burst firing (the average number of burst firing responses per train at 30–40 minutes post-induction as a fraction of the average number of burst firing responses per train in the 10-minute period before induction, or comparable time points in the no-induction group) is shown for each experimental condition. Bar are color-coded according to one of four conditions: 1. Black - no synaptic activation during induction, 2. Green - synaptic activation during induction, resulting in an enhancement of burst firing; 3. Red - synaptic activation during induction, resulting in a suppression of burst firing; and 4. Gray - synaptic activation during induction, resulting in no change in burst firing. Numbers at the bottom of the bars indicate n for that group. The dotted line indicates no change in the number of burst firing responses compared to the baseline period (100% of baseline).

