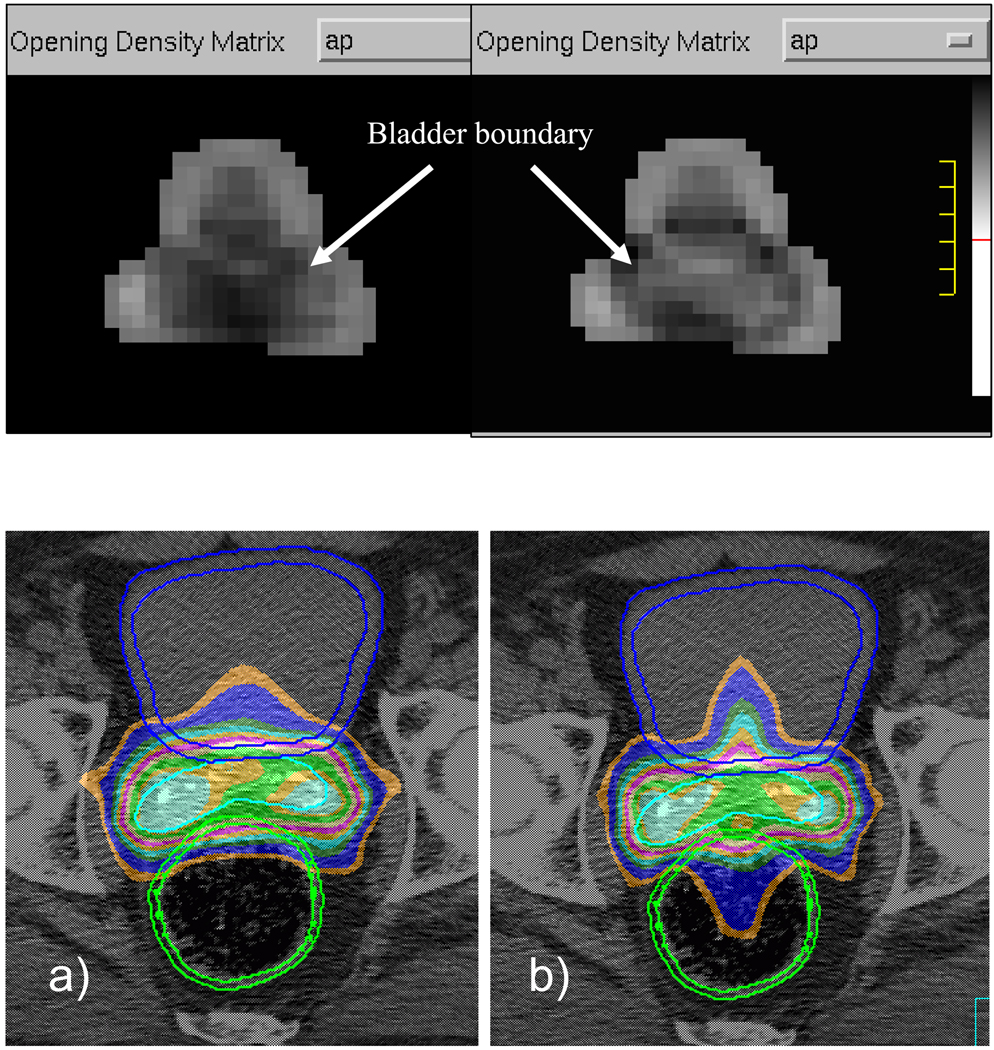
Figure 3.
Top: AP beam fluences from treatment plans optimized with OAR volume (left) and OAR wall (right). Bottom: Isodose profiles from IMRT treatment plans using a) organ volumes and b) organ walls. Bladder wall, seminal vesicles, and rectum wall are contoured in dark blue, light blue, and green, respectively. Isodose levels range from 55–105% of the isocenter dose.

