Fig. 6.
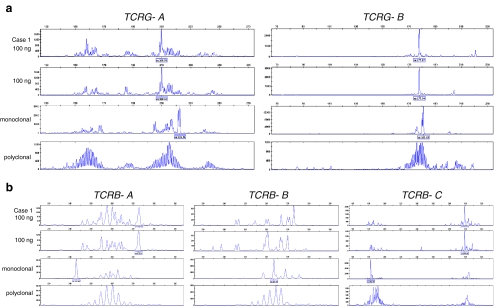
TCR clonality profiles from a diagnostic tissue suspicious for cutaneous T-cell lymphoma. GeneScan results of the Vγ–Jγ TCRG gene rearrangements using the BIOMED-2 TCRG-tubes A and B (a); and of the Vβ–Jβ and Dβ–Jβ TCRB gene rearrangements using the BIOMED-2 TCRB-tubes A, B and C, respectively (b). Shown are the results of the extracted DNA from the patients’ tissue (case 1) in duplicate (100 ng input/PCR), a monoclonal control sample (from a T-cell lymphoma tissue), and a polyclonal control (from a reactive lesion). TCR clonality analysis of case 1 showed two clonally rearranged TCRG genes, which fits to biallelic TCRG clonal rearrangements (a). Also a clonal TCRB-DJ incomplete rearrangement was detected (b: TCRB tube C). The rearrangement pattern of the TCRB-tube A shows a peak pattern, which is interpreted as polyclonal (low signal) (b). The peak at 273 bp is a so-called false peak as described before [16, Table 25], since this peak is particularly seen in samples with low numbers of T cells or in samples in which the clonal TCRB product is seen in one of the other TCRB tubes, which fits with the current case

