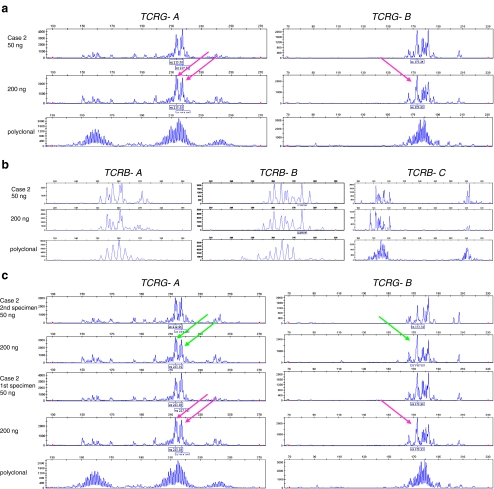
Fig. 8.
TCR clonality profiles from a diagnostic tissue from the cerebellum which is suspicious of a malignant lesion. GeneScan results of the Vγ−Jγ TCRG gene rearrangements using the BIOMED-2 TCRG-tubes A and B (a and c) and of the Vβ–Jβ and Dβ–Jβ TCRB gene rearrangements using the BIOMED-2 TCRB-tubes A, B, and C, respectively (b). Shown are the results of the extracted DNA from the patients’ tissue (case 2) in duplicate (50 and 200 ng input/PCR), with the arrows indicating the suspect clonal peaks, a monoclonal control sample (from a T-cell lymphoma tissue) and a polyclonal control (from a reactive lesion). Clonality analysis of the TCRG gene rearrangements of case 2 demonstrated suspect clonal peaks in a polyclonal background of T-cells (a). The interpretation of these ambiguous clonality profiles was initially difficult. Polyclonal TCRB rearrangements were observed in this case (b). The clonality profiles of 50 and 200 ng input of tube C are slightly different, but in both concentrations, many PCR products are amplified, without dominance of a particular peak, and so these are considered polyclonal. Note that the higher amplicon products of the Dβ1 rearrangements amplify most efficiently in the tube with 50 ng DNA input. Also, TCRD rearrangements were polyclonal (not shown). From the cerebellum lesion, a second independent and representative tissue block was available, which showed the presence of a reproducible profile of the TCRG rearrangement profile (c). The profiles from both biopsies provide evidence for the presence of multiple dominant T-cell clones

