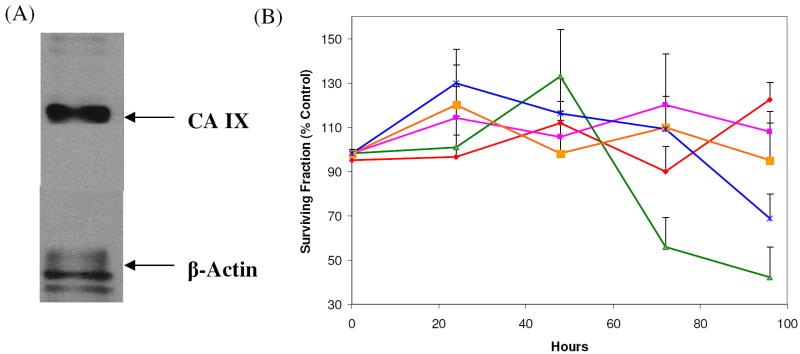
Figure 4.
Cell proliferation analysis in PC-3-Bcl-2 prostate cancer cell lines. (A) Western Blot Analysis verifying the expression of CA IX by the PC-3-Bcl-2 cells. (B) PC-3-Bcl-2 cells were treated with one of the following inhibitors; AZM (red), BZM (magenta), CHL (green), EZM (orange), MZM (blue) at 0.1 mM for 96 hours and then subjected to MTT assay. X axis, exposure time (hours); Y axis, % surviving fraction compared to mock (DMSO only). Only compounds CHL and MZM demonstrated reduced proliferation compared to mock (43% and 68%, respectively). Each assay was performed in triplicate, and the mean for all 3 experiments was calculated. Crystal violet exclusion test confirmed the above MTT results (i.e. decrease proliferation) were associated with increase cell death.

