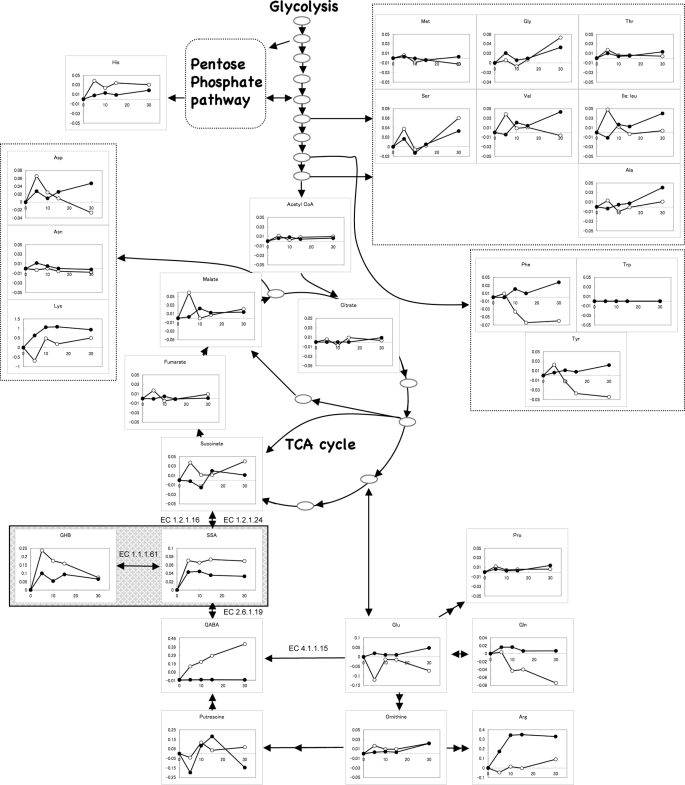
FIGURE 6.
Time course of intracellular metabolite levels in E. coli subjected to SSA treatment. Measurement of metabolites was performed by CE-TOFMS. The x axis and y axis indicate time (min) after SSA addition and metabolite level (nmol/OD/ml), respectively. The level of metabolite is displayed as amount of metabolite (nmol) in 1 ml of culture (OD590 = 1) and represents the difference between untreated and treated samples. The open and closed circles represent the control and YihU overproducing strain, respectively. The expected YihU reaction (EC 1.1.1.61) is highlighted by a shadowed box. The data shown are from a representative dataset from three independent experiments. The other two datasets are in supplemental Fig. S5.

