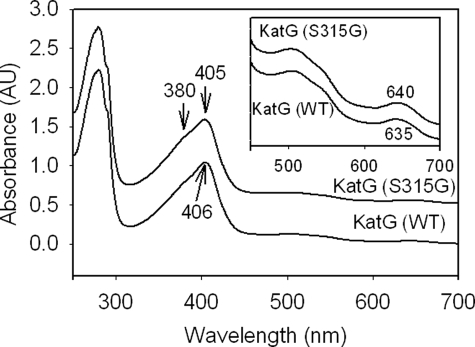
FIGURE 1.
UV-visible spectrum of resting (ferric) WT KatG and KatG[S315G]. Optical absorption spectra of 10 μm wild-type KatG and KatG[S315G] in 20 mm potassium phosphate buffer, pH 7.2, at 25 °C are shown. Spectra are offset for presentation purposes. Differences in the absorbance maxima marked by arrows are relevant to the greater abundanceof 5-c heme in the mutant. AU, absorbance units. Inset, expanded visible region of spectra.

