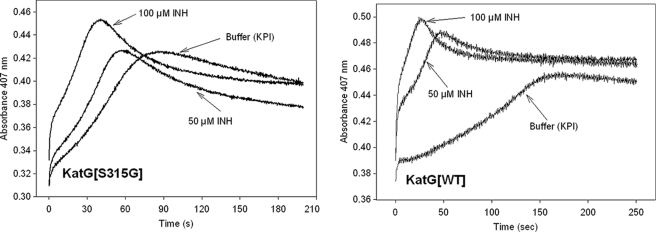
FIGURE 5.
Reaction of WT KatG (right) and KatG[S315G] Fe(IV) = OPor+· (left) with INH.5 Absorbance versus time traces (at 407 nm) for double mixing stopped-flow experiments are shown. Resting enzymes were prereacted with PAA to form Fe(IV) = OPor+·, followed by the addition of increasing concentrations of INH. The final concentrations of enzyme and PAA were 5 and 25 μm, respectively; the final concentrations of INH are as labeled in the figure for each time trace.

