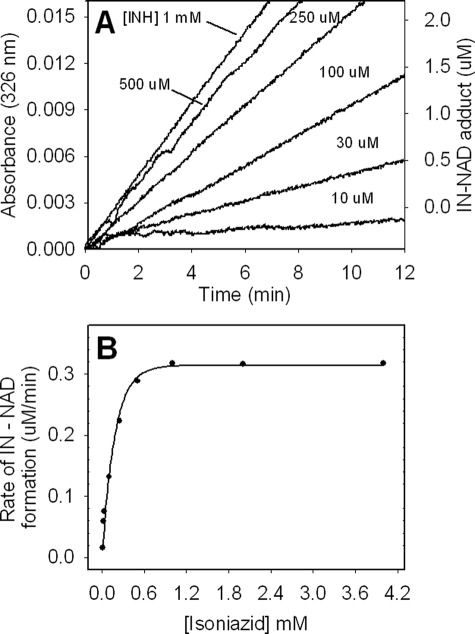
FIGURE 6.
Effect of INH concentration on the rate of production of the IN-NAD adduct. A, IN-NAD adduct formation was followed at 326 nm. KatG[S315G] (0.5 μm), NAD+ (50 μm), and H2O2 (2 μm/min generated enzymatically using Glu/glucose oxidase were incubated with varying concentrations of INH. B, rates of IN-NAD adduct formation as a function of INH concentration.

