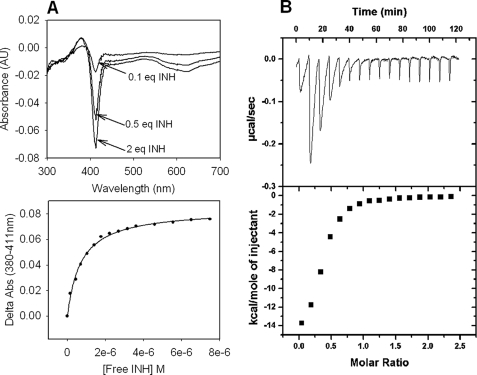
FIGURE 7.
Binding of INH to KatG[S315G]. A, optical titrations with INH. Optical titrations were performed using 5 μm enzyme and increasing concentrations of INH (top panel). Difference spectra were obtained by subtracting the spectrum of free KatG from that of the INH-bound enzyme for each increment of addition. Binding curves were generated by plotting the absorbance difference for the peak minus the trough absorbance values at 380 and 411 nm, respectively, versus the concentration of free INH (bottom panel). B, isothermal titration of KatG[S315G] with INH. ITC experiments were carried out at 25 °C in phosphate buffer, pH 7.2, using 10 μm KatG. The top panel shows the isothermal traces measured from a series of injections of INH into enzyme. Heat (integrated values in μcal/s/injection; lower panel) were fitted to a single binding site model. The Kd value calculated from the optical titration was 0.7 μm, and the value from the ITC titration was 1.4 μm.

