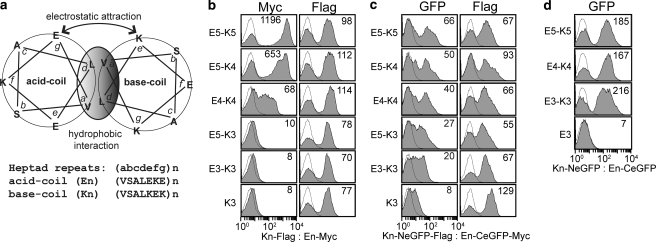
FIGURE 2.
Detection of coiled coil interactions by epitope expression and GFP complementation. a, a schematic diagram (adapted from the Fig. 1 by De Crescenzo et al. (17)) of the acid (En)-base (Kn) coiled coils with n indicating the number of heptad repeats. b and c, the detection of coiled coil interactions by antibody binding to Myc tag (b) or direct GFP readout (c) using flow cytometry. Antibody binding to the FLAG tag measures the level of the base coil expression on cell surface. d, shown are the plots of GFP complementation caused by the coiled coil interactions occurring inside the cells. The numbers in each plot (b–d) indicate the MFI of an entire population shown in filled histogram. The thin lines represent the histograms of uninduced clones. The pairs of bait and prey are denoted for each column as bait:prey. The labels K3 and E3 indicate that the other coil is deleted from the expression vector.

