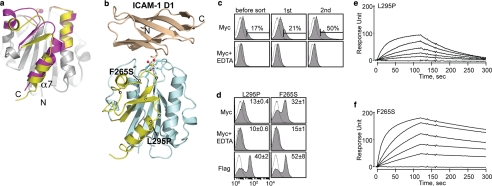
FIGURE 5.
Discovery of allosteric activation in the I domain. a, cartoon diagrams of low (inactive) and high affinity (active) conformations of the LFA-1 I domains. The regions that are structurally conserved between two states are colored gray. The regions that differ structurally are colored in magenta and yellow for the inactive and the active conformations, respectively. The metal ions in the metal ion-dependent adhesion site are shown as spheres. The N and C termini and α7-helix are labeled. b, the structure of the I domain is shown in complex with the first domain of ICAM-1 (D1). Gray spheres with a white center display the positions for the hot spots for allosteric activation found in our previous study (10). The metal ion and three oxygen atoms of water molecules are depicted as spheres. The residues that coordinate to the metal ion are shown in stick models. The structures of the I domains and the complex of I domain with the ICAM-1 were modeled based on the crystal structures, as described previously (31). c, Myc expression of the I domain library before sort and after first and second sort are shown. The numbers indicate the percentage of the clones within the gated region. Antibody binding was measured with 10 mm MgCl2 or no metal ions with 10 mm EDTA. d, two activating mutations from the second sort were of F265S and L295P. The numbers in each plot indicate means ± S.E. of the MFI of the filled histograms from three independent measurements. e and f, SPR measurements of L295P (e) and F265S (f) binding to scFv AL-57. I domains were injected over the scFv AL-57-coated chip as a series of 2-fold dilutions beginning at 500 nm.

