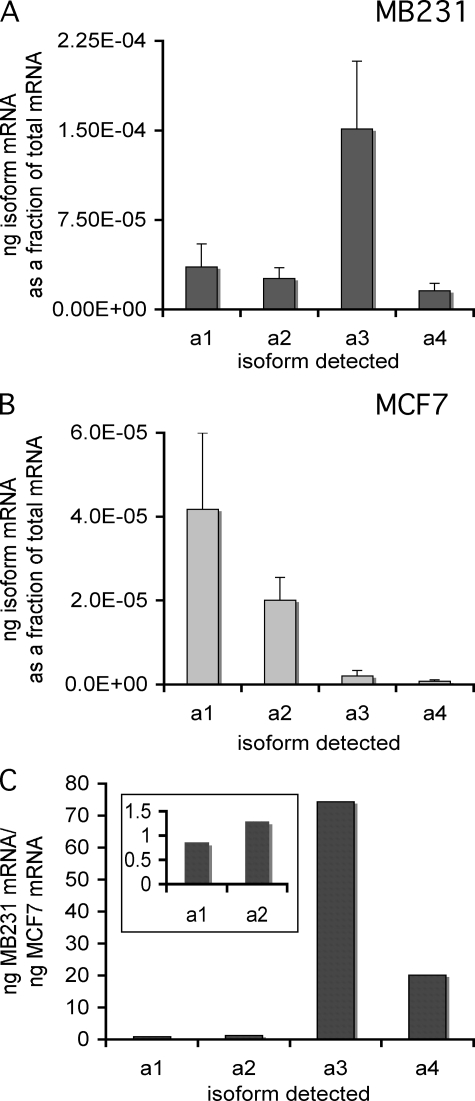
FIGURE 1.
mRNA levels of subunit a isoforms in MB231 and MCF7 cells. Using mRNA isolated from cells, quantitative RT-PCR was used to determine the mRNA levels of the different subunit a isoforms, as described under “Experimental Procedures.” Plasmids expressing the cDNA for each isoform were used to construct a standard curve. All values are normalized to total mRNA loaded as determined by Quant-iT RiboGreen® reagent. The values reported are the ratio of nanograms of isoform-specific mRNA to the total nanograms of mRNA. A, a subunit isoform-specific mRNA levels in MB231 cells. B, a subunit isoform-specific mRNA levels in MCF7 cells. C, ratio of a subunit isoform-specific mRNAs in MB231 versus MCF7 cells. Inset shows data for a1 and a2 on an expanded scale. n = 7, error bars indicate standard deviation.

