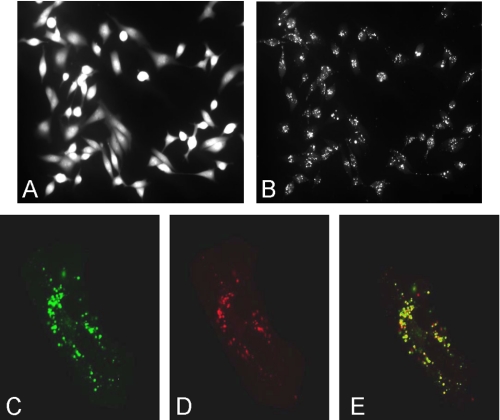
FIGURE 3.
Fluorescent pH indicators in cytosol and endosomes/lysosomes. MB231 cells were loaded with 1 mm 8-hydroxypyrene-1,3,6-risulfonic acid (pyranine), to label endosomes/lysosomes or 7 μm of the acetoxymethyl ester form of SNARF-1 to label the cytosol as described under “Experimental Procedures.” A, fluorescence image of cells loaded with SNARF-1, excited at 534 nm, and the fluorescence emission signal collected at 590 nm (long bandpass filter). B, same field as for A, except that pyranine was excited at 465 nm and its emission collected at 514 nm (20 nm bandpass). C–E, cells incubated with pyranine as in A were washed to remove extracellular pyranine and further incubated with 2 μm LysoTracker® Red DND-99 for 3 min to label endosomes/lysosomes. C, cells were transferred to the microscope chamber, and the fluorescence of pyranine was excited at 458 nm and the emission collected from 514 to 540 nm. D, fluorescence of LysoTracker® Red was excited at 543 nm, and the emission was collected from 580 to 650 nm. E shows the merge of C and D and indicates that these fluoroprobes exhibit significant co-localization.

