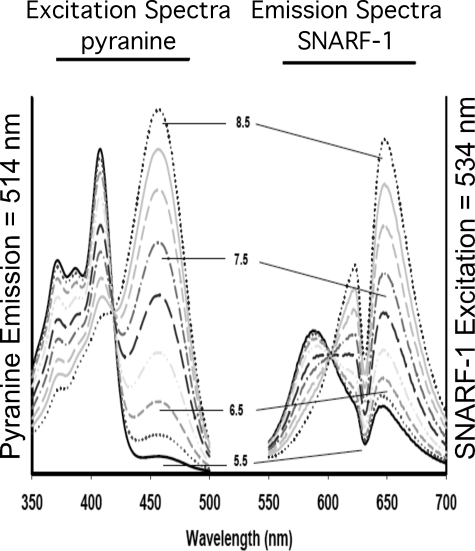
FIGURE 4.
Spectral properties and pH dependence of fluorescence of SNARF-1 and pyranine. 1 μm pyranine and 2 μm SNARF-1 (free acid) were dissolved in high K+ buffer and spectral properties evaluated as follows. The excitation spectra of pyranine were collected using an emission wavelength of 514 nm, whereas the emission spectra of SNARF-1 were acquired using 534 nm as the excitation wavelength. Note that these fluoroprobes do not exhibit spectral overlap and do not exhibit fluorescence resonance energy transfer that could hamper the interpretation of the data. For pyranine, an increase in the excitation peak at 465 nm and a decrease at 405 nm as pH is increased from 5.5 to 8.5 is observed. 415 nm represents the isoexcitation wavelength and is used to evaluate dye concentration and/or quenching artifacts. For SNARF-1, the emission signal at 644 nm decreases and at 584 nm increases as pH is decreased. 600 nm represents the isoemissive wavelength. Consequently, the fluorescence ratios at 465/405 and 644/584 nm can be used to monitor pH in endosomes/lysosomes and cytosol, respectively, using a ratiometric approach that allows quantitation of pH.

