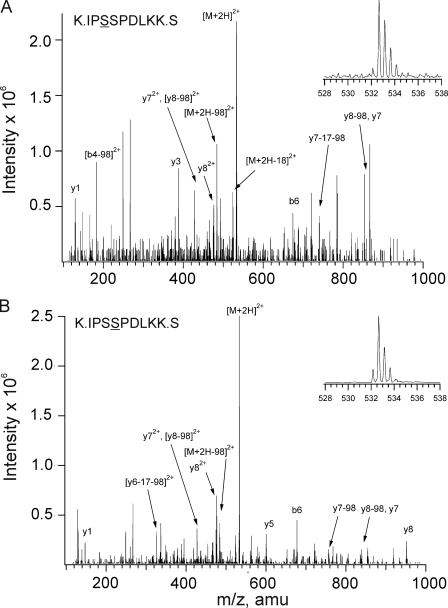
FIGURE 6.
Identification of Ser-440 and Ser-441 as additional sites of in situ phosphorylation of Kv1.2. MS/MS spectra obtained from MIDAS analysis of tryptic digest of control HEK 293 cell Kv1.2 with ion assignments based on Mascot annotation and manual validation. A, spectrum of early eluting phosphopeptide. B, spectrum of late eluting phosphopeptide. Insets in each panel represent enhanced resolution scans of the respective precursor ions (m/z 532.7). Identical spectra were obtained for 8-Br-cAMP-treated cells expressing Kv1.2-WT. amu, atomic mass units.

